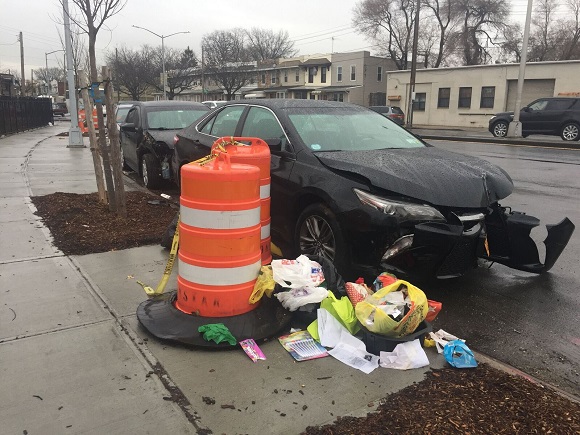
I work in downtown Manhattan, so naturally one would find themselves observing the litter that builds up day-after-day as thousands of people traverse around the Civic Center. After walking by the Brooklyn Bridge section of City Hall on a Monday morning – I couldn’t help but notice the sheer amount of garbage covering the ground after a Manhattan weekend. But this isn’t just incidental to Manhattan – go anywhere in the five boroughs outside a residential area and you will ask yourself – Why does New York City still feel so dirty?
I looked at some of the New York City public data, determined to figure it out. New Yorkers filed a record 103,320 sanitation complaints through 311 in 2025. The Department of Sanitation responded with 558,872 civil violations, also the highest annual total on record. And yet the Police Department, which used to issue tens of thousands of summonses a year for the same kind of street disorder, including public urination, littering, and sidewalk obstruction, wrote barely 13,100. Less than half its 2014 peak.
This analysis draws on twenty years of city data: 274,922 NYPD Quality of Life (QOL) summonses since 2006, 5.86 million DSNY civil violations since 2010, and 1.22 million 311 sanitation complaints since 2010. The two enforcement arms reach different parties for different acts. DSNY writes its tickets to property owners and building managers for failing to keep the sidewalk clean, set trash out properly, or recycle correctly. The NYPD wrote its summonses to the individuals on the street for the acts that produce that disorder in the first place, primarily public urination and littering. DSNY enforcement has climbed to record highs in recent years. NYPD enforcement fell sharply after the City Council’s 2017 Criminal Justice Reform Act (CJRA) and has not come back.
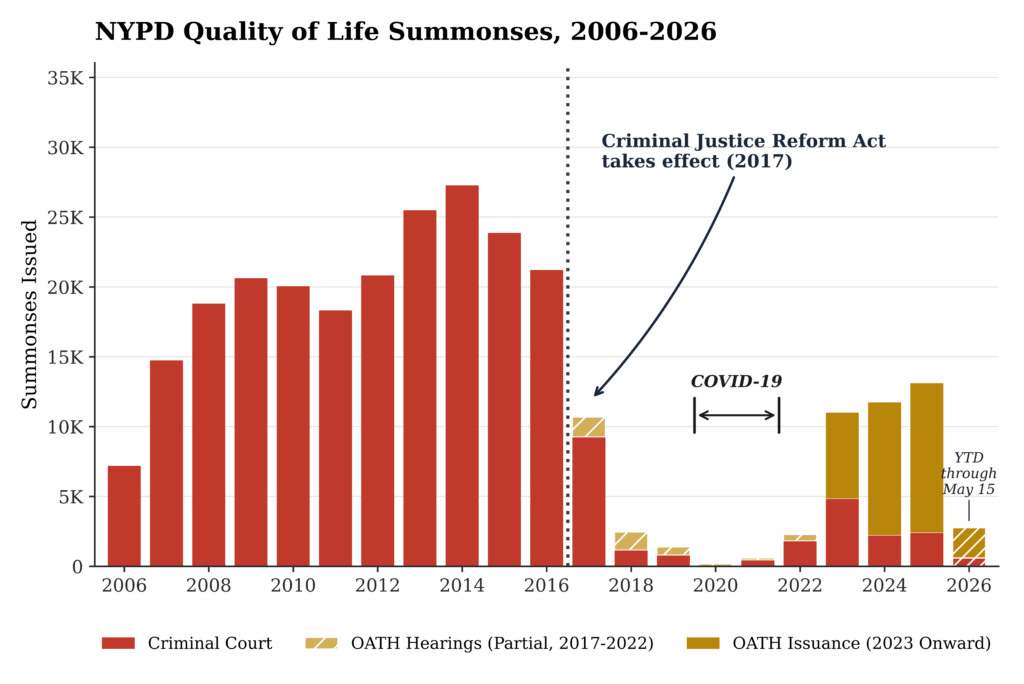
Figure 1. NYPD Quality of Life summonses by year,2006 to 2026.
NYPD enforcement of these offenses was high and steady for years, peaking at 27,306 summonses in 2014. Officers wrote these under Administrative Code § 16-118, the main NYC statute governing street-cleanliness, and through the mid-2010s under a parallel Health Code provision, 153.01, that the NYPD phased out after 2016.
After the CJRA, criminal-court enforcement of quality of life disturbances collapsed – within two years it had fallen to roughly 1,200 cases. This was because the CJRA caused the NYPD to move most of this enforcement onto civil OATH tickets, rather than criminal ones. OATH is the Office of Administrative Trials and Hearings, the city’s administrative court for non-criminal violations. But the overall totals never recovered, and the tickets themselves changed character. A criminal summons required the defendant to answer in court. A civil OATH summons does not. The defendant can skip the hearing, the city mails a default bill, and the penalty becomes a civil debt subject to collections.
In 2025, NYPD enforcement of § 16-118 only came to about 13,100 summonses, still less than half the 2014 peak. The partial OATH data for 2017 to 2022 covers only cases that reached a hearing and undercounts the tickets issued in those years. Still, more than eight years after the CJRA, NYPD street-level enforcement of these offenses sits far below where it used to be.
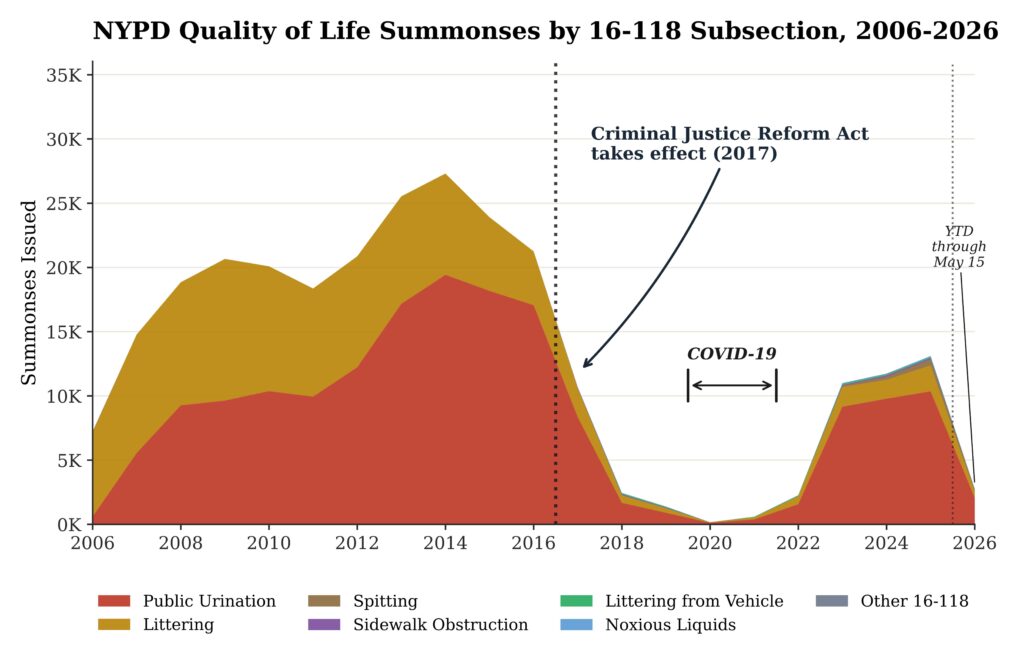
Figure 2. NYPD Quality of Life summonses by 16-118 subsection, 2006 to 2026.
Almost every NYPD 16-118 summons is written for one of two offenses: public urination or littering. Both have collapsed since their pre-reform peaks.
Public urination peaked at 19,420 summonses in 2014. The NYPD only wrote 10,348 in 2025, a drop of nearly half. Littering is worse. The peak was 11,029 in 2009. By 2025 NYPD wrote 2,024. Less than a fifth of where it was.
Everything else under § 16-118 accounts for under 1 percent of the twenty-year total. The smaller subsections in Table 1 only became identifiable after enforcement moved to OATH. The blank cells in the 2014 column reflect categories the pre-reform coding did not separate.
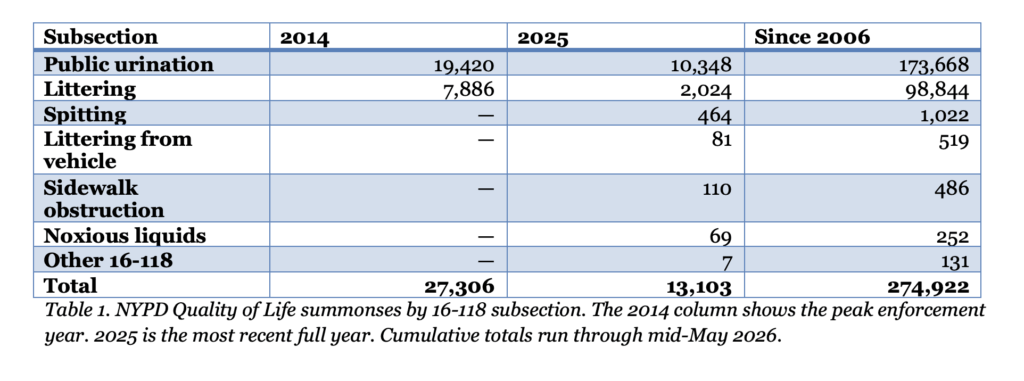
Table 1. NYPD Quality of Life summonses by 16-118 subsection.
The 2014 column shows the peak enforcement year. 2025 is the most recent full year. Cumulative totals run through mid-May 2026.
DSNY enforcement has moved in the opposite direction, and at far greater scale. Its tickets are written to the property owner or the building, not to the passerby.
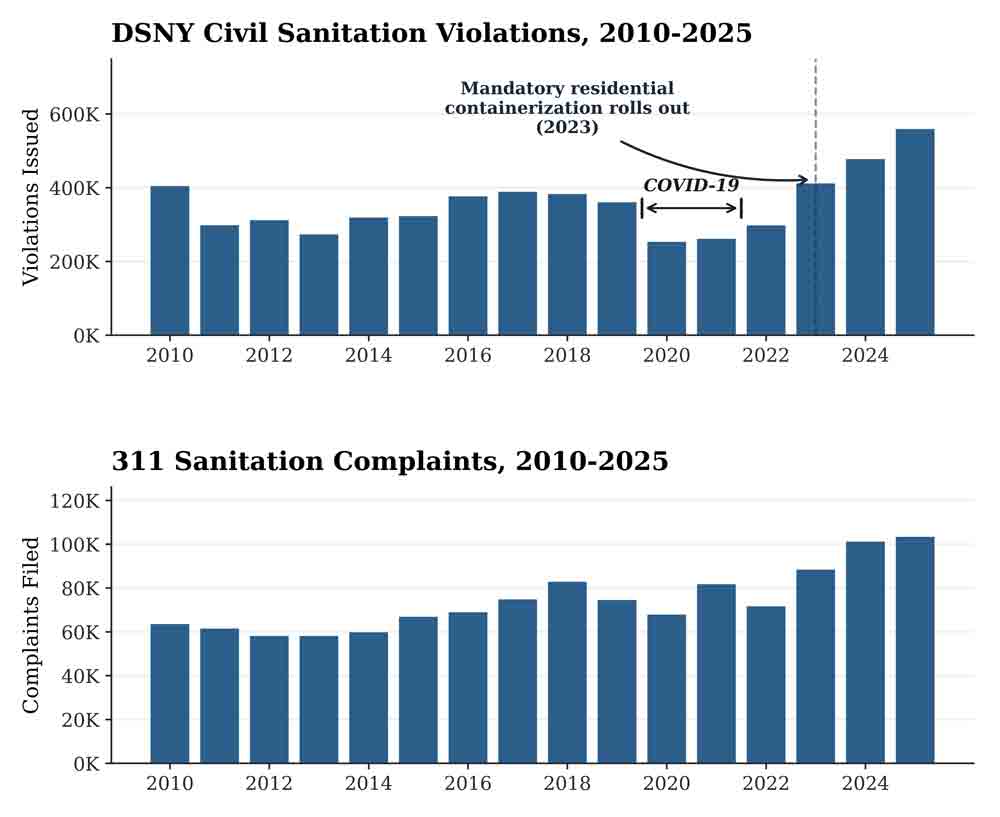
Figure 3. DSNY civil sanitation violations by year, top panel, and 311 sanitation complaints by year, bottom panel. Both series cover 2010 to 2025.
DSNY employs civilian enforcement agents who walk the streets, inspect sidewalks and trash setouts, and write civil violations directly to the property owner or building manager. The most common citation is failure to clean the 18 inches of curb and gutter in front of a building, a strip the city makes the property owner’s responsibility. DSNY enforcement spans several statutes. Property-owner cleanliness duties fall under § 16-118(2)(a), the same section the NYPD uses but a different subsection. Receptacle violations such as loose trash, improper disposal, and storage of receptacles, fall under § 16-120.
DSNY violations ran around 340,000 a year through the 2010s, dropped to 253,000 in the first pandemic year, then started climbing. The agency issued 411,541 in 2023, 477,268 in 2024, and 558,872 in 2025. Through mid-May 2026 it has already written another 162,676.
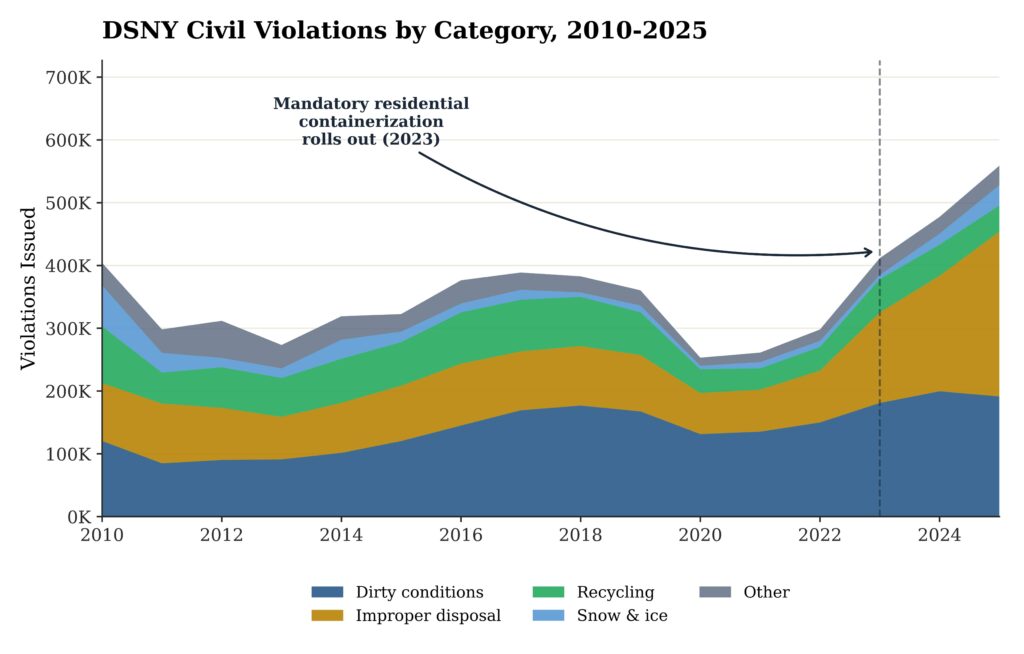
Figure 4. DSNY civil sanitation violations by category, 2010 to 2025. Categories grouped from the charge description on each ticket.
Figure 4 breaks those violations into five buckets. The largest is dirty conditions — failures to clean the 18-inch curb strip in front of a building, dirty sidewalks, and dirty areas. That bucket has grown almost every year on the chart, from about 120,000 a year in the early 2010s to 191,000 in 2025. The improper-disposal bucket accounts for the post-2022 surge following the Adams administration’s trash containerization rule. DSNY wrote about 83,000 improper-disposal tickets in 2022 and 263,000 in 2025, more than triple. Recycling violations ran 50,000 to 90,000 a year before 2020 and have settled in the 33,000 to 53,000 range since. The “other” bucket covers street obstructions, illegal handbill postings, and a long tail of smaller charge types. None of the five buckets covers the person who creates the litter on the street. DSNY tickets the property owner or the building, the party with a registered address the city can mail to.
Further, DSNY has imposed $862.5 million in penalties since 2010 and collected $424 million, a 49.2 percent collection rate. DSNY imposed $76.2 million in fines alone in 2025.
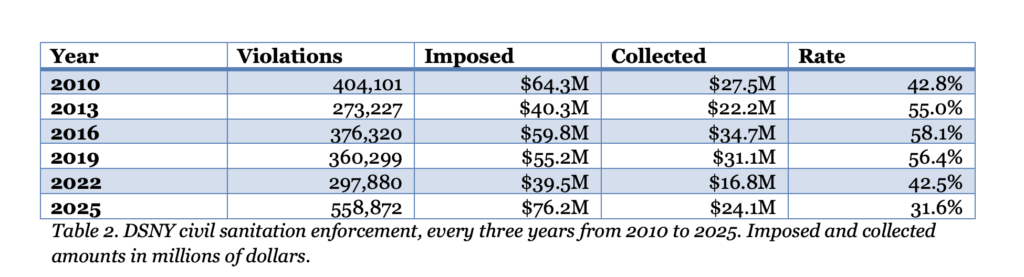
Table 2. DSNY civil sanitation enforcement, every three years from 2010 to 2025. Imposed and collected amounts in millions of dollars.
Even with DSNY pushing for QOL enforcement, 311 complaint volume has still climbed to record rates. The bottom panel of Figure 3 shows sanitation complaints rising from around 60,000 a year in the early 2010s to 103,320 in 2025, roughly 70 percent above the early 2010s baseline. The series captures dirty-condition and illegal-dumping reports. 311 records who calls the city, not the actual state of the street, so the line is a rough signal rather than a count of how dirty New York is.
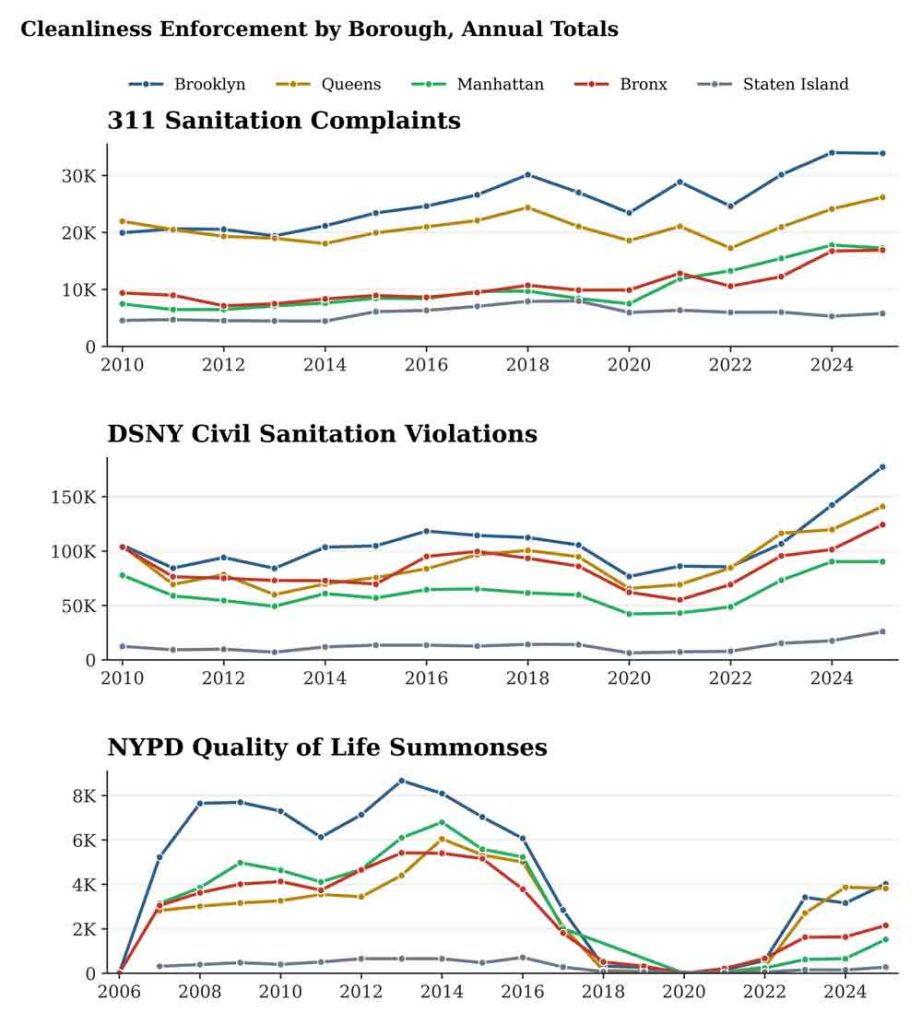
Figure 5. Cleanliness enforcement by borough. Annual totals from each dataset’s earliest publication year through 2025.
Brooklyn leads on every measure in nearly every year on the chart, and Staten Island trails on every measure. The middle three boroughs have moved around, with Queens overtaking Manhattan for second on NYPD QOL summonses since the CJRA.
What the data does not show is whether New York is dirtier than it was twenty years ago. What it does show is who the city is writing tickets to, and for what. DSNY has more than doubled its civil enforcement on property owners and building managers since the early 2010s. NYPD enforcement of the offenses that produce visible street disorder, primarily public urination and littering, sits at less than half its 2014 peak and has not recovered in the eight years since the CJRA.
The two halves are not substitutes for each other. In my view, the reason it still feels dirty walking past City Hall on a Monday morning is that the enforcement aimed at the conduct on the sidewalk has collapsed. The enforcement that has surged is aimed somewhere else. Manhattan, where this piece began, used to rank second among the boroughs for NYPD enforcement of these offenses. Today it ranks fourth.
ryanedwardkelly64@gmail.com
electoralanalytics.net
Data Sources: NYC Open Data.
311 Service Requests
OATH Hearings Division Case Status
NYPD Criminal Court Summons, Historic and Year-to-Date
NYPD OATH Summons Data