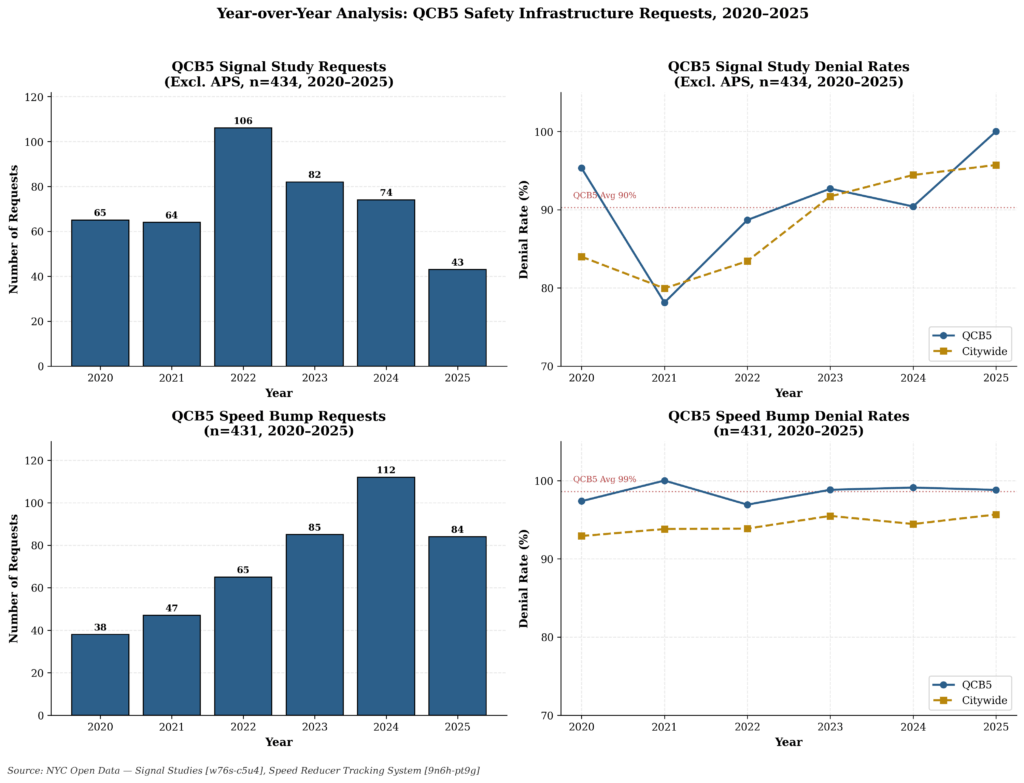
Figure 1-
Year over Year QCB5 Infrastructure Requests,
SSRs and SRTS (2020 – 2025)
Queens Community Board 5, like nearly every community board in the city, submits safety infrastructure requests to the Department of Transportation and watches most of them disappear or be outright rejected. Residents, elected officials, and community boards across the city request new traffic signals, stop signs, and speed bumps through 311 or by contacting DOT directly.
Each request enters an engineering review and comes back approved or denied. In many cases, neither happens — a study is conducted, and nothing changes for years. These requests sit in the DOT’s administrative black hole – with no action in sight.
This piece draws on five years of city data: 434 signal study requests (court-mandated accessible pedestrian signals excluded), 431 speed bump requests, and roughly 3,213 injury crashes within QCB5 between 2020 and 2025, all publicly available on NYC Open Data.
The bottom line is that conditions at denied locations are not improving — THEY ARE BAD AND STAYING BAD.
The DOT denied or took no action on approximately 90% of QCB5’s signal study requests over the past five years (See Figure 1). That is not an outlier. The citywide denial average is 88%. Manhattan sits near 95%. Even the Bronx, the borough with the lowest rejection rate, still turns away more than three out of four requests. Certain categories — left turn signals, leading pedestrian intervals — have a zero percent approval rate over the entire five-year period, both locally and citywide. Communities are submitting requests that the system simply will not grant.
Speed bumps are worse. QCB5’s denial rate has climbed to effectively 100% in recent years, and every Queens community board sits between 91% and 100% (See Figure 2). Nearly all of those denials come down to a single rule: the DOT measures traffic speed with radar and denies any location where the 85th-percentile speed – the speed 85% of drivers stay below – falls under 30 mph. That criterion accounts for 84% of all speed bump denials in QCB5. DOT is asking whether most cars are already going under the limit. Residents are asking whether the street is dangerous. Those are different questions. And when you map denial locations against crash data, the disconnect becomes more apparent.
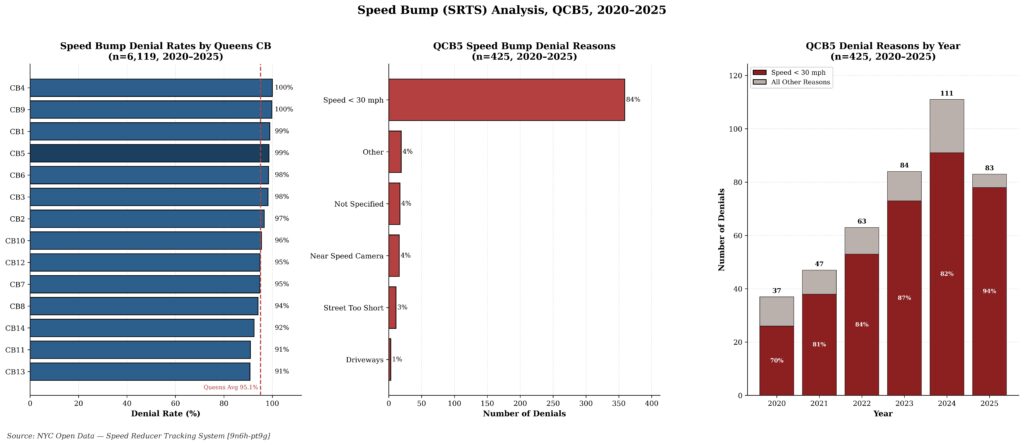
Figure 2 –
QCB5 Speed Bump Denial Rate Analysis (2020–2025)
I plotted every denied and approved signal study and counted injury crashes within 150 meters — roughly a block and a half, which is the DOT’s own standard analysis radius under Vision Zero (See Figure 3). Denied locations have significantly more nearby crashes than approved ones. The evaluation process is not directing resources toward the most dangerous intersections. The Metropolitan Avenue corridor near Aubrey Avenue has 66 crashes and 101 injuries within 150 meters since 2020 and remains without signal changes despite years of requests. Myrtle Avenue through Ridgewood and the lower Maspeth corridor along Grand Avenue tell the same story.
The downstream cost is real: unaddressed hazardous conditions, more police tied up on traffic incidents, fewer available for investigations that take criminals off the streets. The map below shows how this plays out across QCB5. Outside of upper Ridgewood, major corridors are not seeing meaningful safety improvements.
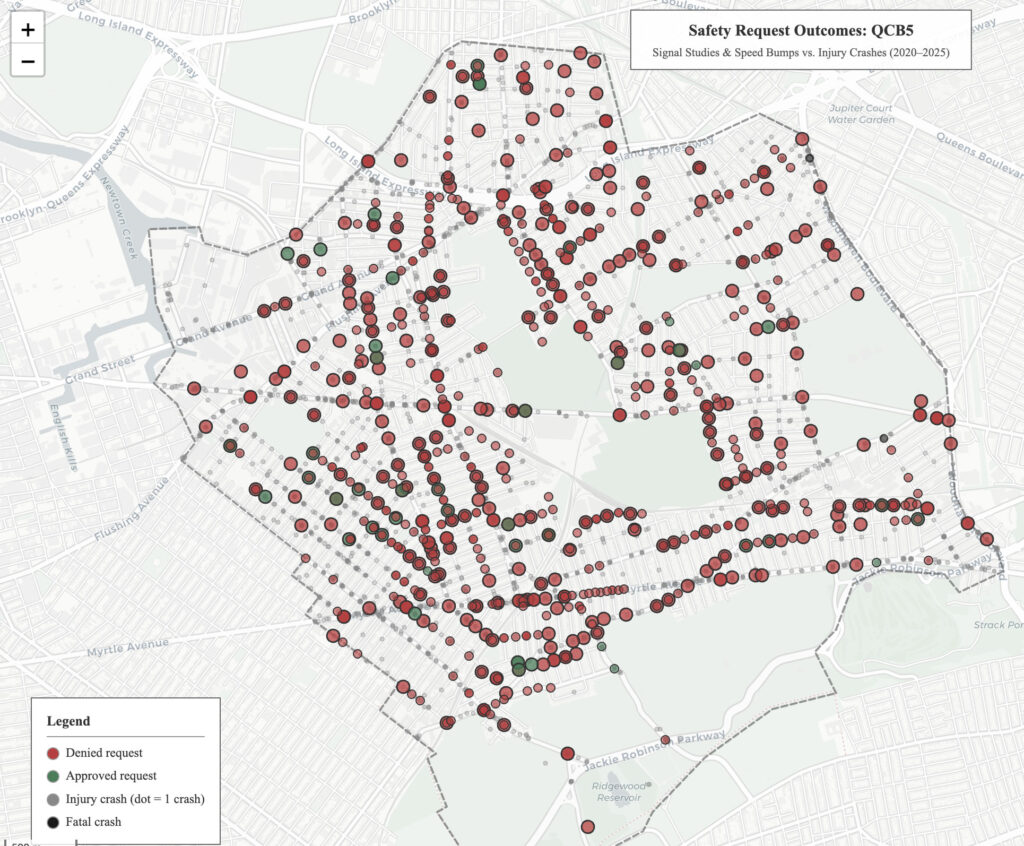
Figure 3 –
QCB5 Map Annotated with Denials, Approvals, and Crash Hotspots. (APS excl 2020-2025)
None of this suggests DOT’s engineers are acting in bad faith. They are applying their criteria as written. But the criteria have become structurally misaligned with the goal they exist to serve: reducing injuries. The speed threshold measures whether drivers are already compliant, not whether pedestrians are at risk. The signal study process evaluates warrant thresholds that are not publicly documented, and unlike speed bumps, the DOT does not publish denial reasons for signal requests — the data simply states, “Study Request Denial.” The current system denies requests at the locations where people need them most. Five years of the DOT’s own data show that the evaluation criteria are not aligned with the goal they exist to serve: reducing injuries.